
The Insights dashboard provides administrators with a comprehensive view of learning activity, engagement, and skills development across their organisation. Insights helps you measure platform adoption, track learner progress, and identify opportunities to improve learning outcomes.
Accessing Insights
Insights is available to users with Admin permissions.
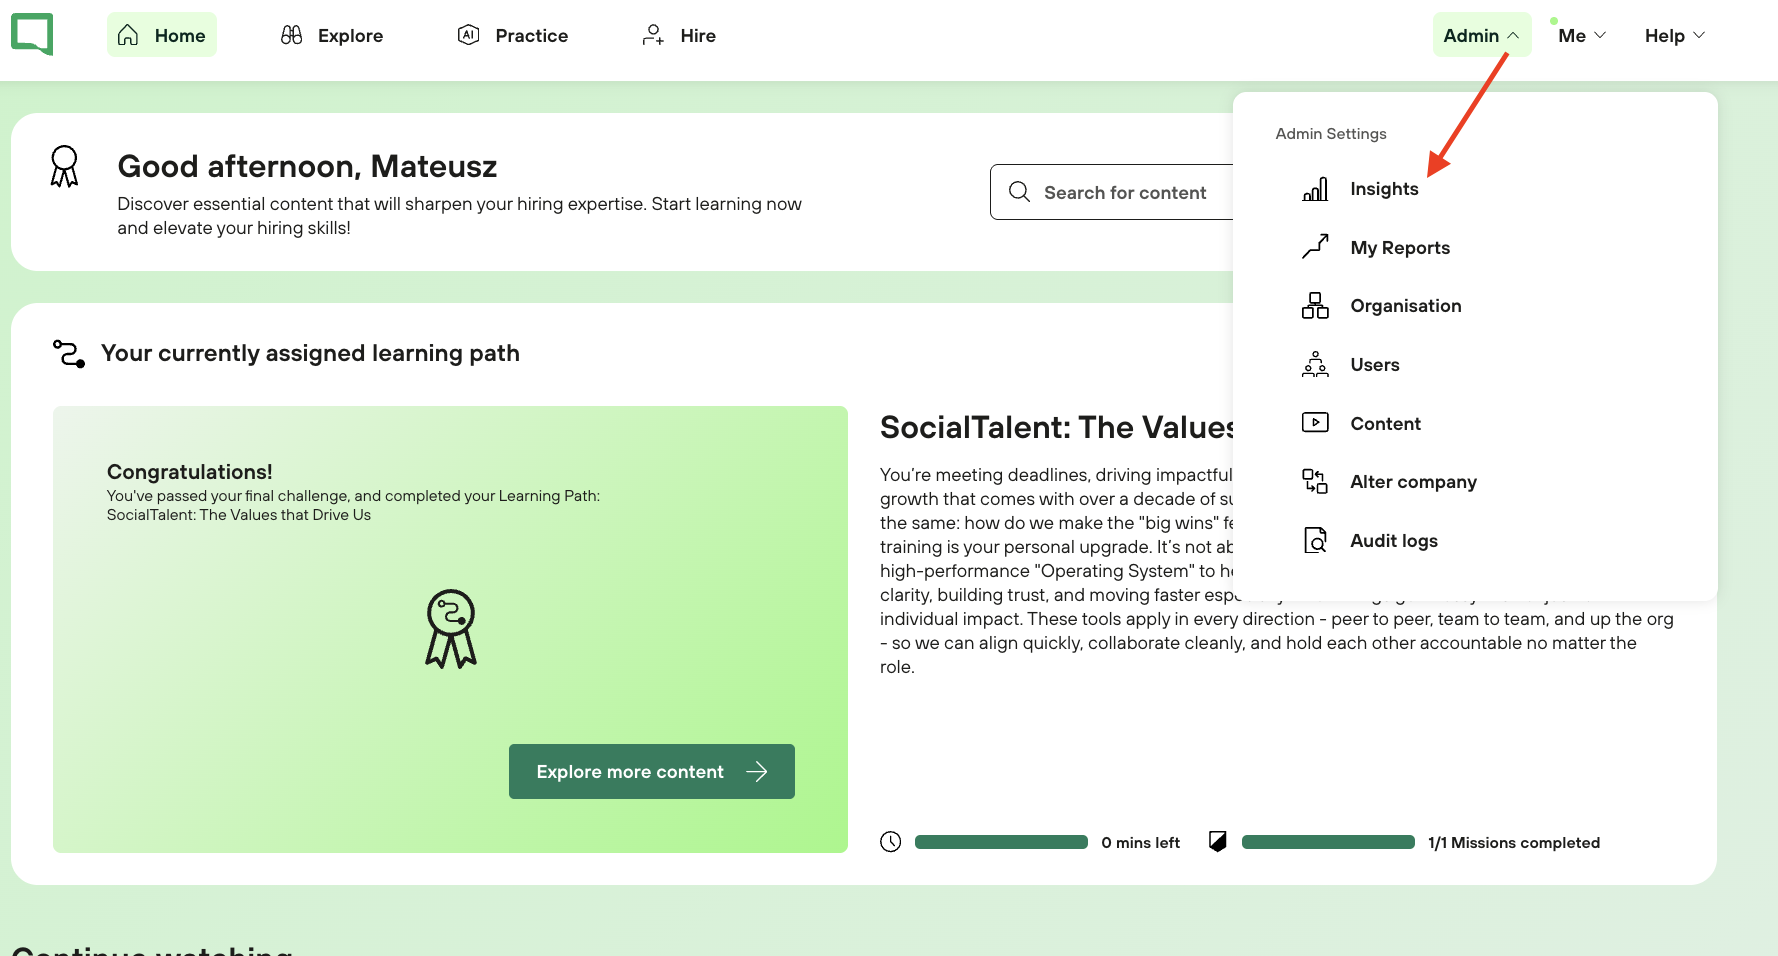
To access the dashboard:
-
Log in to SocialTalent.
-
Select Admin from the top navigation menu.
-
Click Insights.
Using Filters
At the top of the dashboard, you can refine the data displayed using the available filters:
|
Filter |
Description |
|---|---|
|
Date Range |
Select a predefined reporting period, such as Last 30 Days. |
|
Licence Type |
View data for all licences or filter by Interviewer or Recruiter licences. |
|
Region |
Restrict results to a specific geographic region. |
|
Team |
Focus on a specific team within your organisation. |
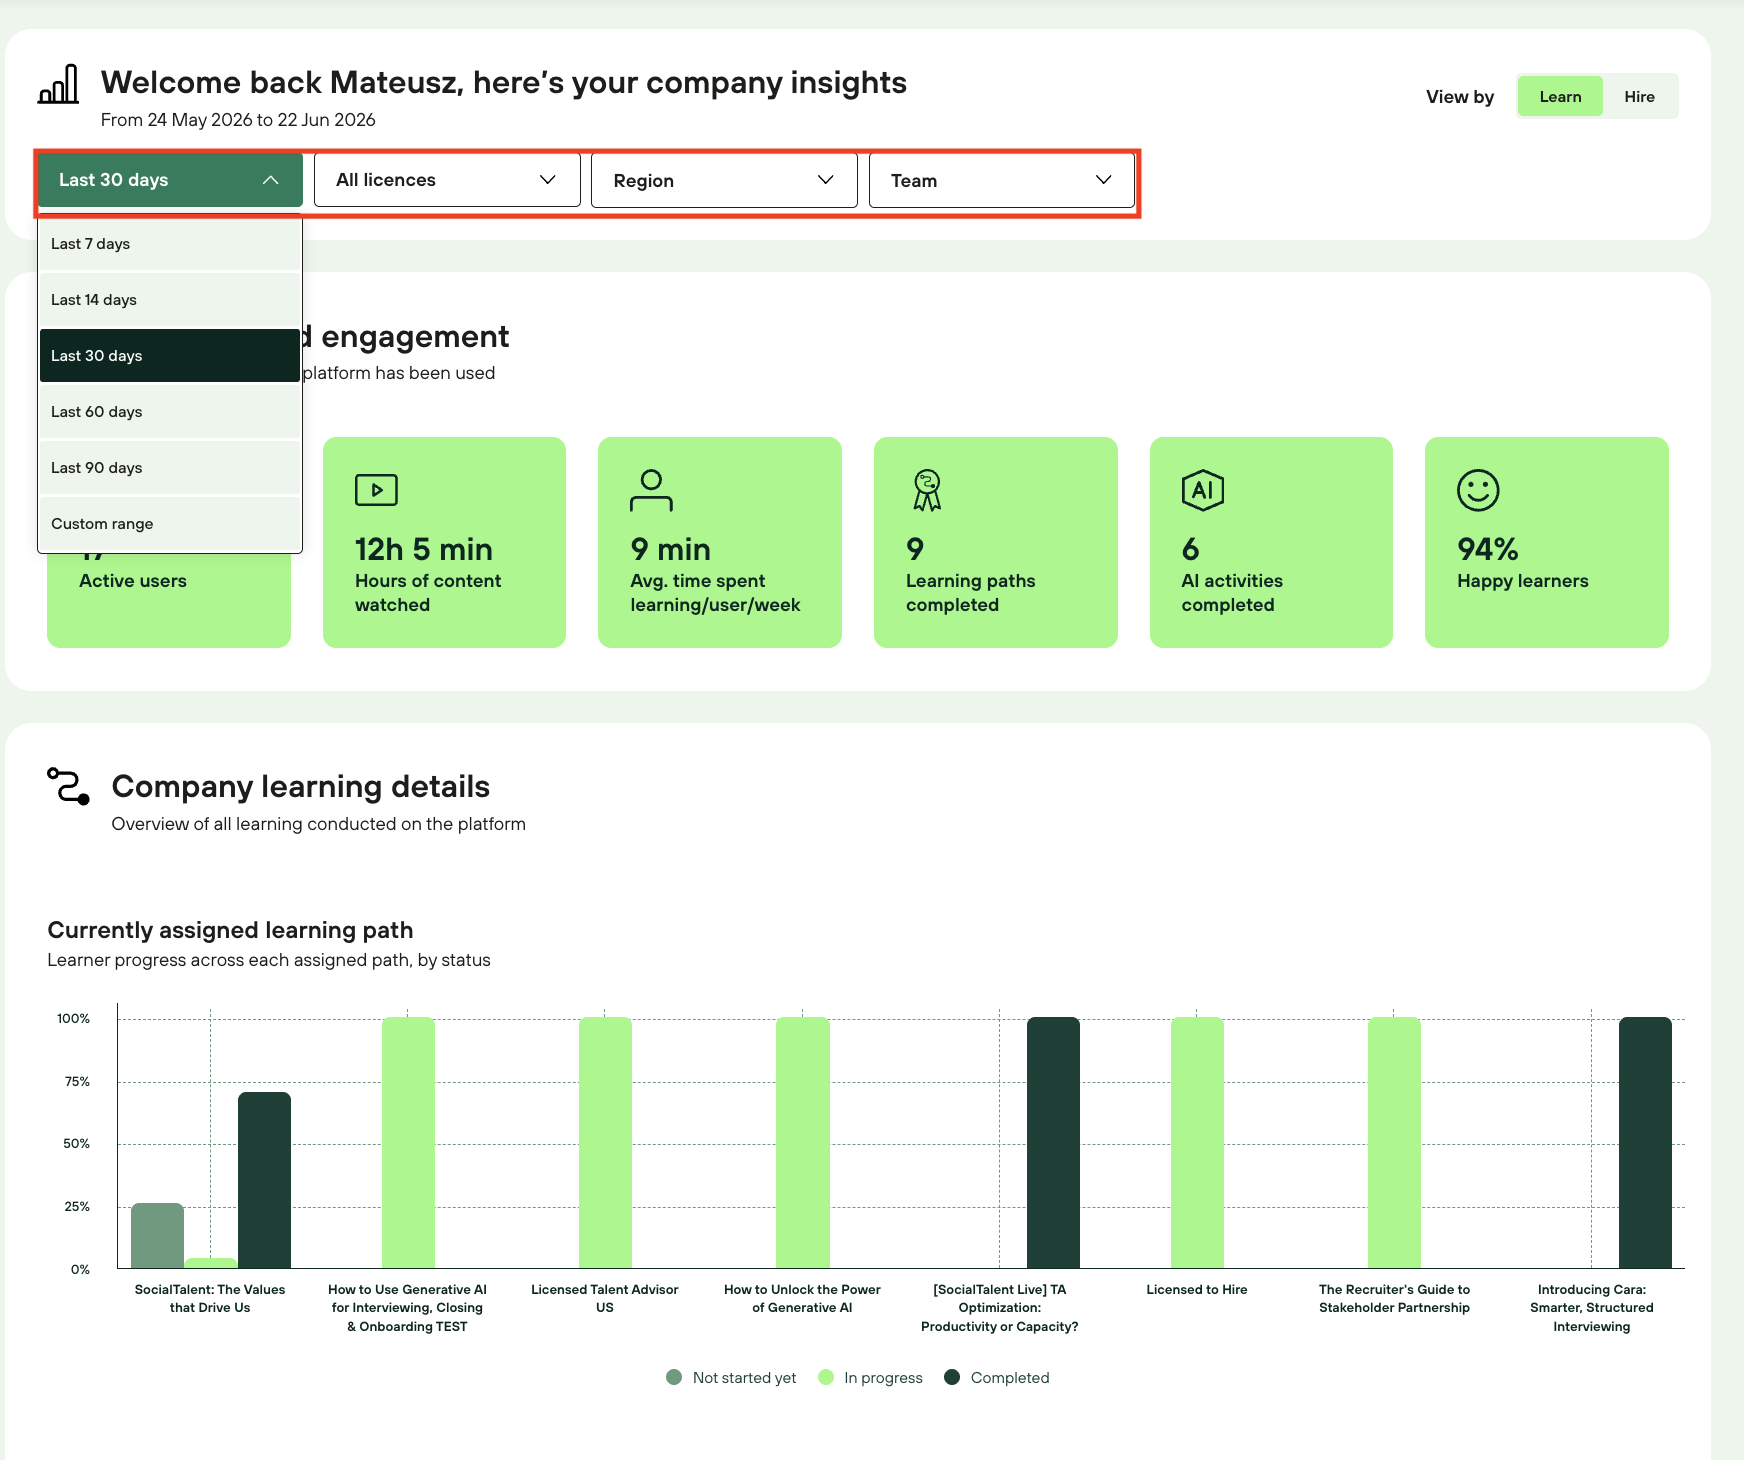
Note: After updating any filter, click Apply to refresh the dashboard. Filter changes are not applied automatically.
Adoption and Engagement
The Adoption and Engagement section provides a high-level overview of platform usage during the selected reporting period.
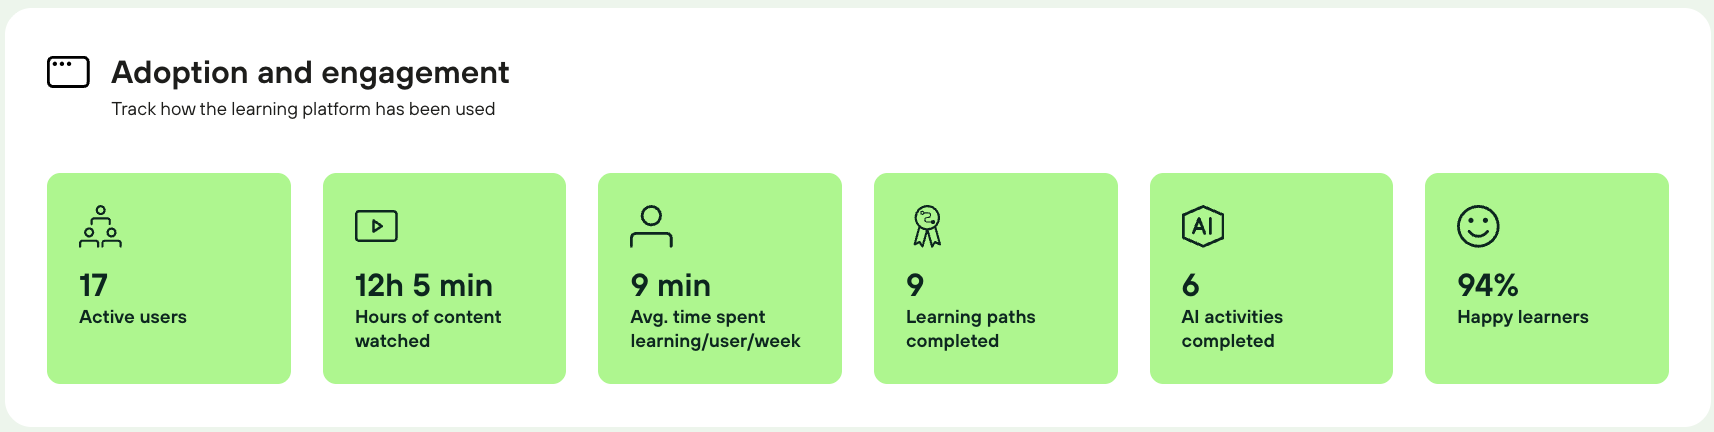
The following metrics are available:
|
Metric |
Description |
|---|---|
|
Active Users |
The number of unique users who engaged with SocialTalent during the selected period. |
|
Content Watched |
Total amount of video content viewed by learners. |
|
Average Time Spent Learning per User per Week |
The average number of learning minutes completed by each active learner per week. |
|
Learning Paths Completed |
The total number of learning path completions during the selected period. |
|
AI Activities Completed |
The number of AI-powered activities completed by learners. |
|
Happy Learners |
The percentage of learners who provided positive feedback on their learning experience. |
Company Learning Details
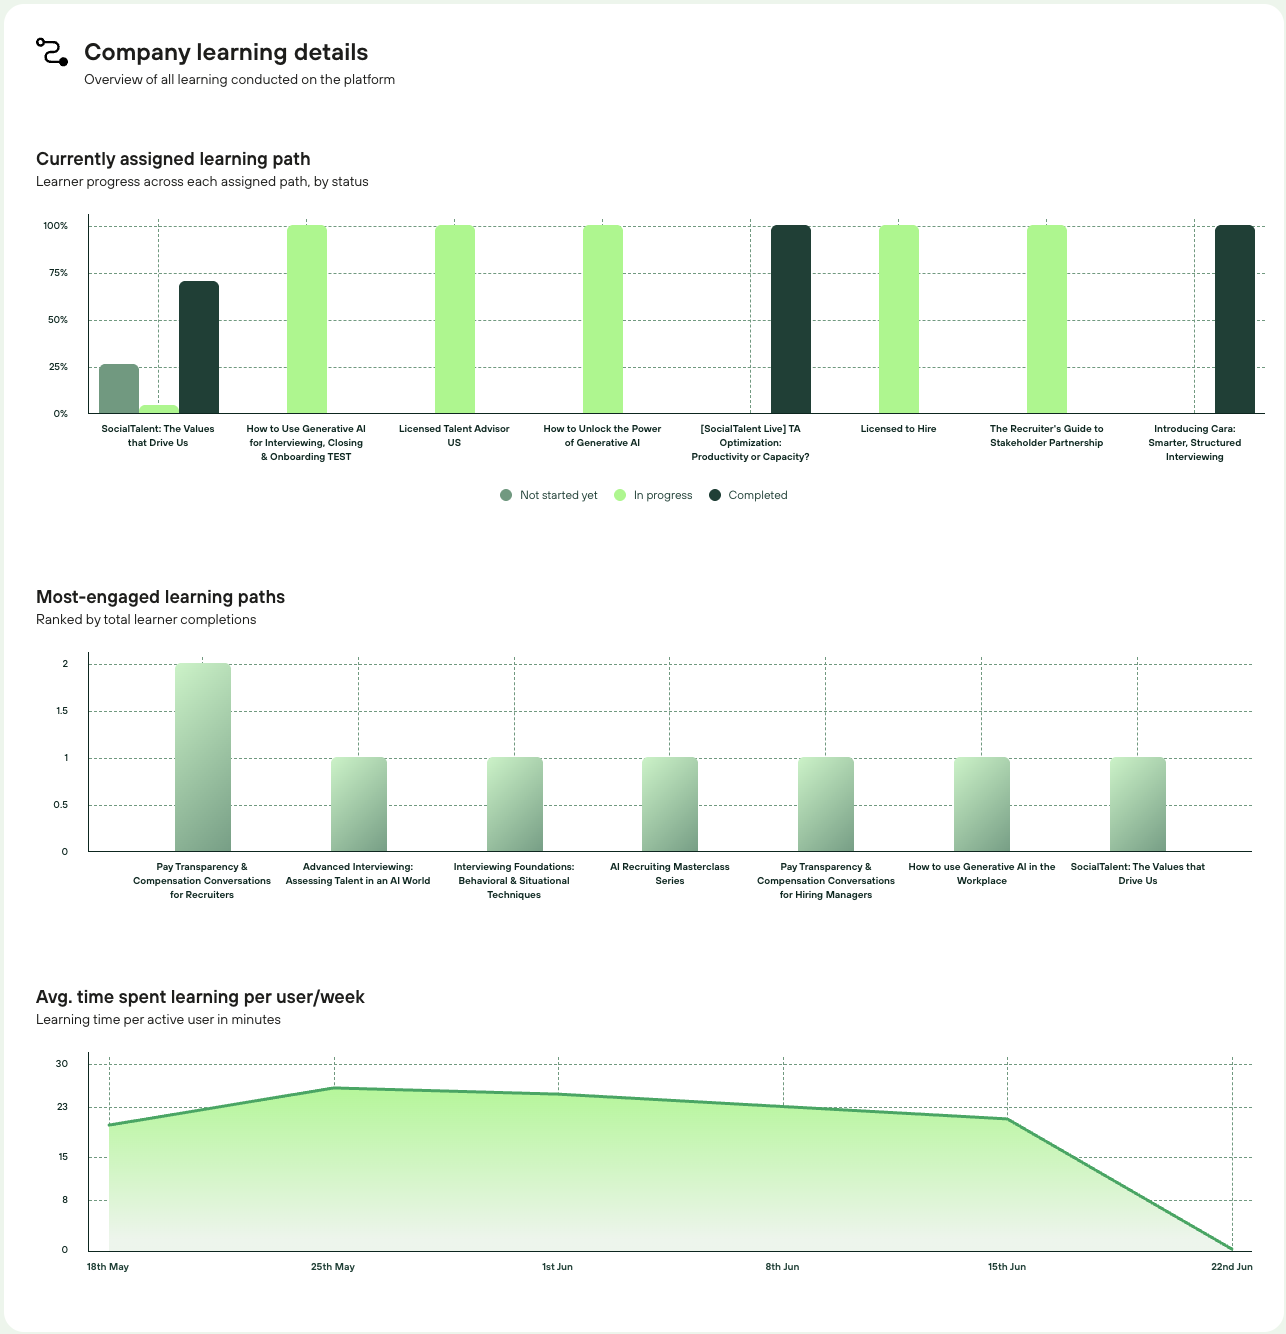
This section provides deeper insights into learning activity across your organisation.
Currently Assigned Learning Paths
This chart displays learner progress for all assigned learning paths, grouped by status:
-
Not Started Yet
-
In Progress
-
Completed
Use this chart to identify learning paths with strong completion rates and those that may require additional promotion or follow-up.
Note: This chart always reflects the current status of learner progress and is not affected by the selected date range.
Most-Engaged Learning Paths
This chart ranks learning paths based on the total number of completions.
It helps identify the content that is generating the highest engagement across your organisation.
This chart respects the filters and date range selected at the top of the dashboard.
Average Time Spent Learning per User per Week
This trend chart shows how learner engagement changes over time by tracking average learning minutes per active user.
Use it to identify patterns such as:
-
Increased engagement following a new learning path launch
-
Reduced engagement after a campaign or initiative ends
-
Long-term learning trends within teams or regions
Note: This chart currently displays the most recent 30 days of data and does not support custom date-range filtering.
Company Skills Development
The Company Skills Development section provides a view of learning activity by skill category.
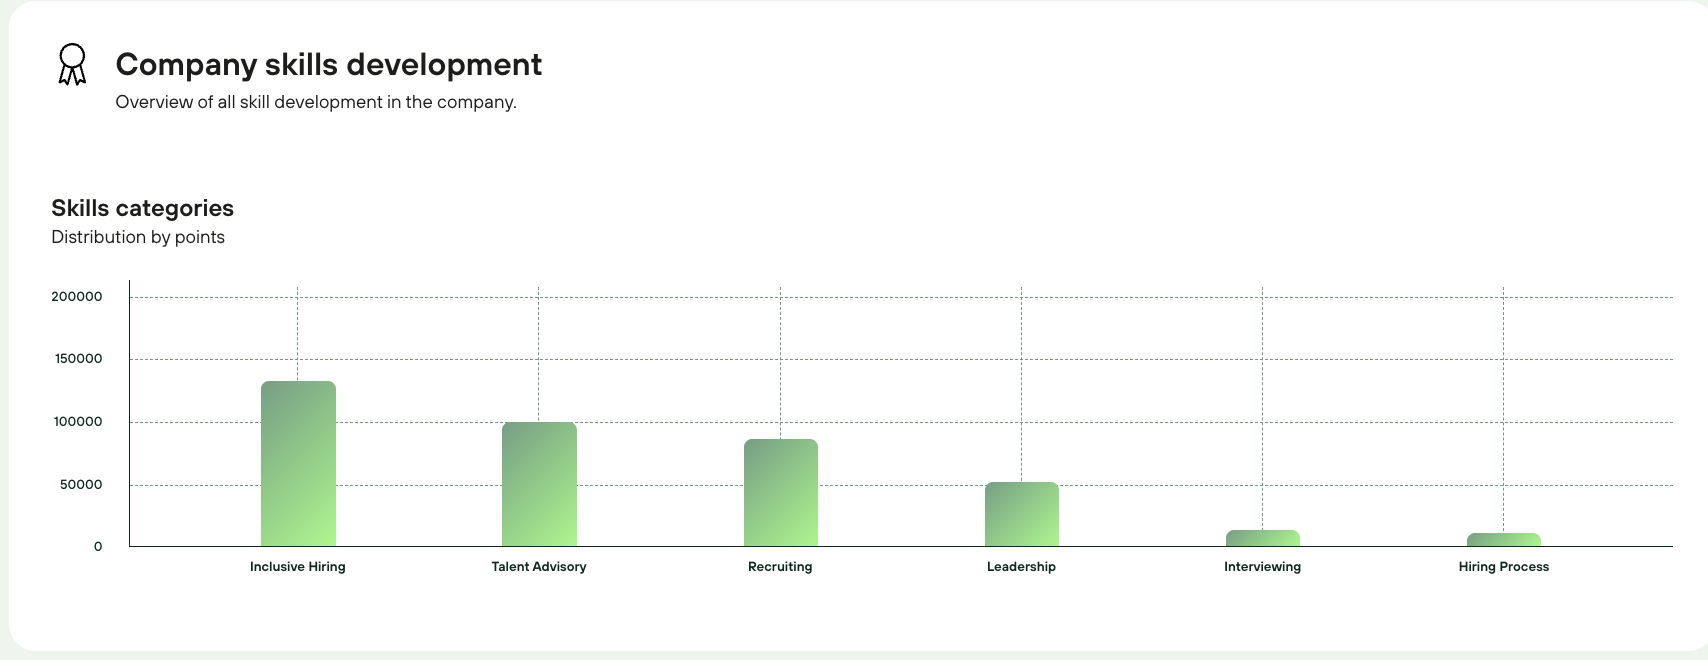
Examples of skill categories include:
-
Talent Advisory
-
Recruiting
-
Leadership
-
Inclusive Hiring
-
Hiring Process
-
Interviewing
The chart displays the cumulative number of learning points earned across each category by all learners in your organisation.
Use this view to:
-
Understand where skills development is strongest
-
Identify potential capability gaps
-
Support future learning and development planning
Note: This chart displays cumulative learning data and is not affected by the selected date range.
Frequently Asked Questions
Why isn't my data updating after I change a filter?
After changing a filter, click Apply to refresh the dashboard. Changes are not applied automatically.
Why doesn't the Average Time Spent Learning chart reflect my selected date range?
The Average Time Spent Learning chart is currently limited to displaying the most recent 30 days of activity and cannot be filtered by a custom date range.
Why doesn't the Currently Assigned Learning Paths chart change when I apply date filters?
This chart reflects the current status of assigned learning paths and therefore is not affected by date-based filters.
Why doesn't the Company Skills Development chart change when I apply date filters?
The Company Skills Development chart displays cumulative learning data for your organisation and is designed to show overall skills growth rather than activity within a specific period.
Who can access Insights?
Insights is available only to users with Admin permissions.
If you do not see the Insights option in the Admin menu, contact your organisation's SocialTalent administrator.
Need Additional Help?
If you have questions about Insights or need assistance interpreting your data, contact your Customer Success Manager or SocialTalent Support Team.