How to use Reports?
Below you will find some helpful information to help you navigate the Reports section. If you'd like to view our course related to the SocialTalent Reports, you can do so here.
My Reports
Templates
By default, template reports related to: Engagement, Goal Tracking, Licenses, Milestones, Learning Badges, Certificates, Mission Progress, Content Feedback, and Popular Content are available.
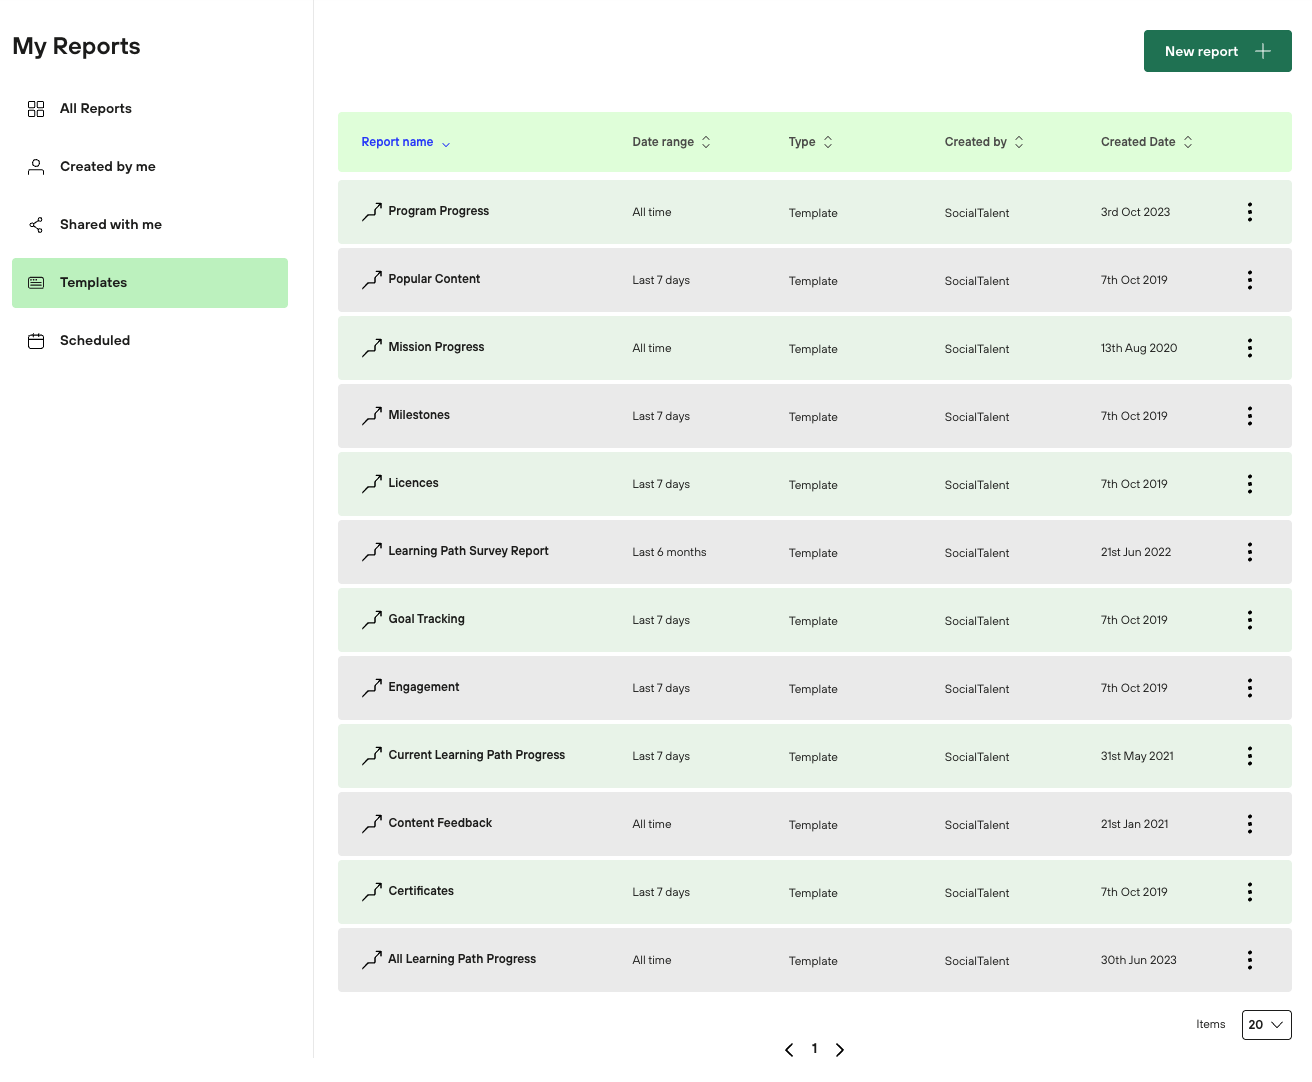
Add a Custom Report
The “New report” button in the top right corner provides the option to create your own custom view of the data.
Define the Outline Attributes
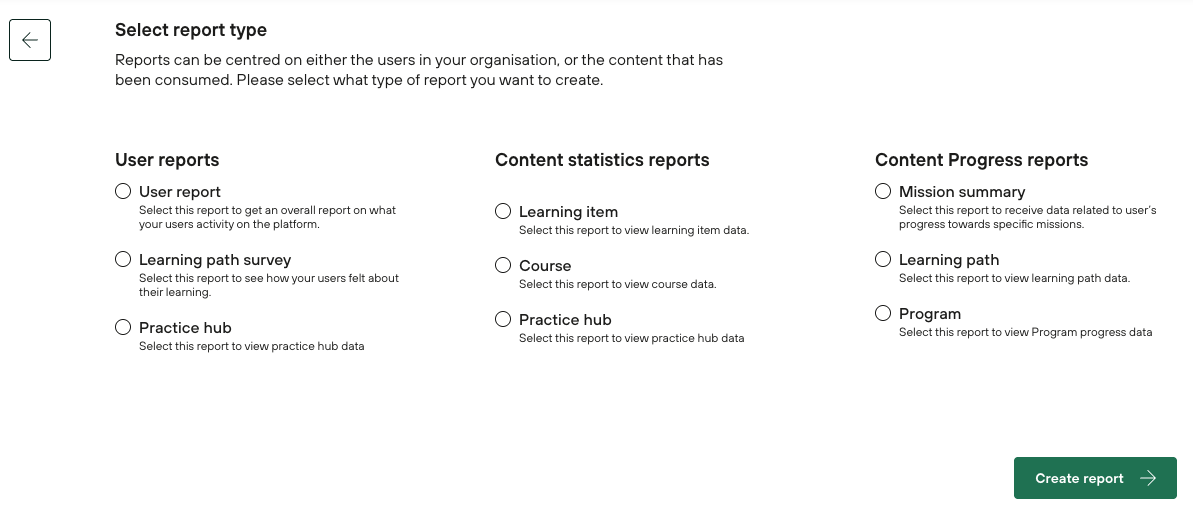
Select Report Type and click “Create report”
Select Columns
Your report will contain some columns by default
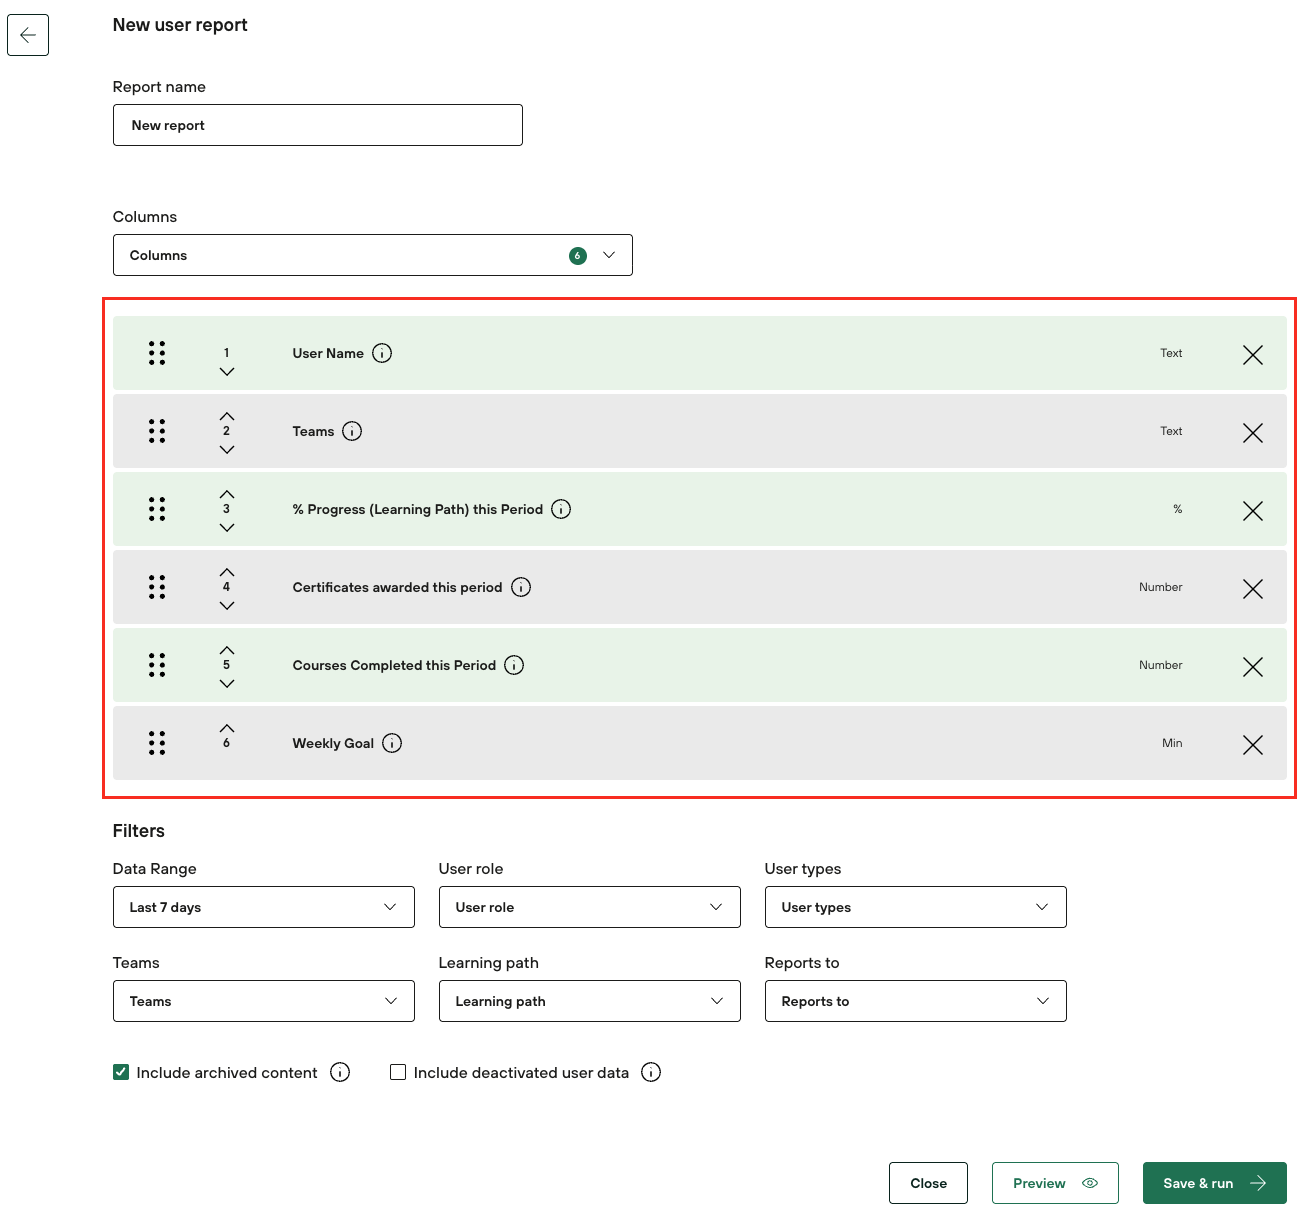
Click the “Columns” option to choose the columns you want on the Report.
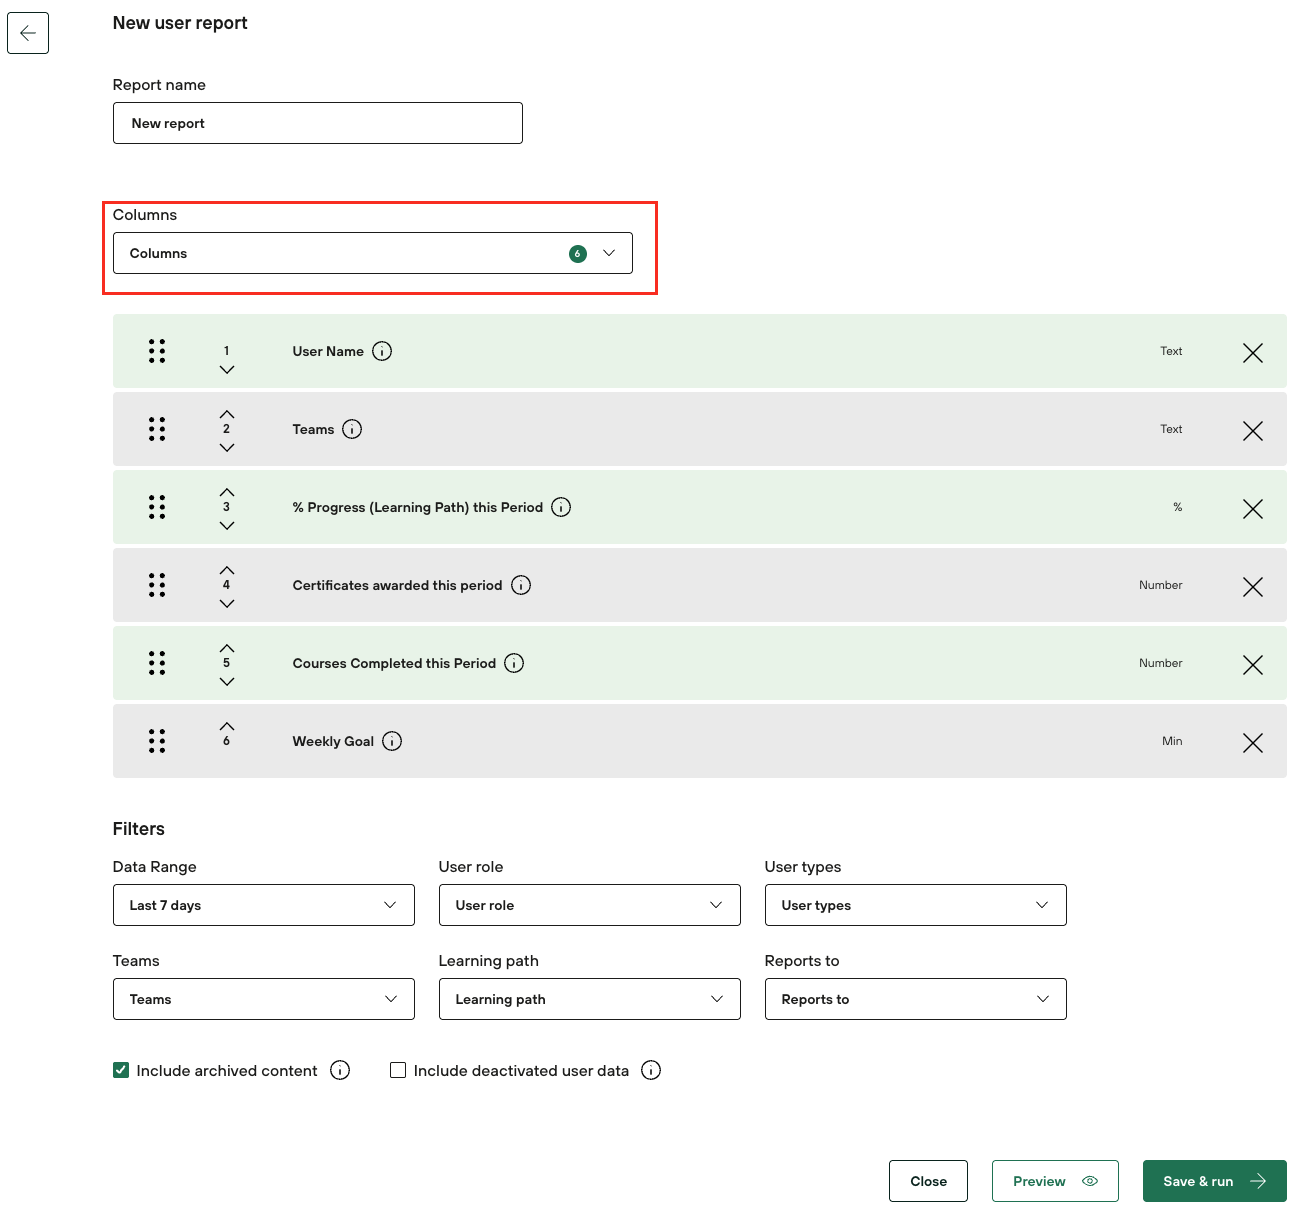
If you hover over the ‘i’ icon, it will also display the column description
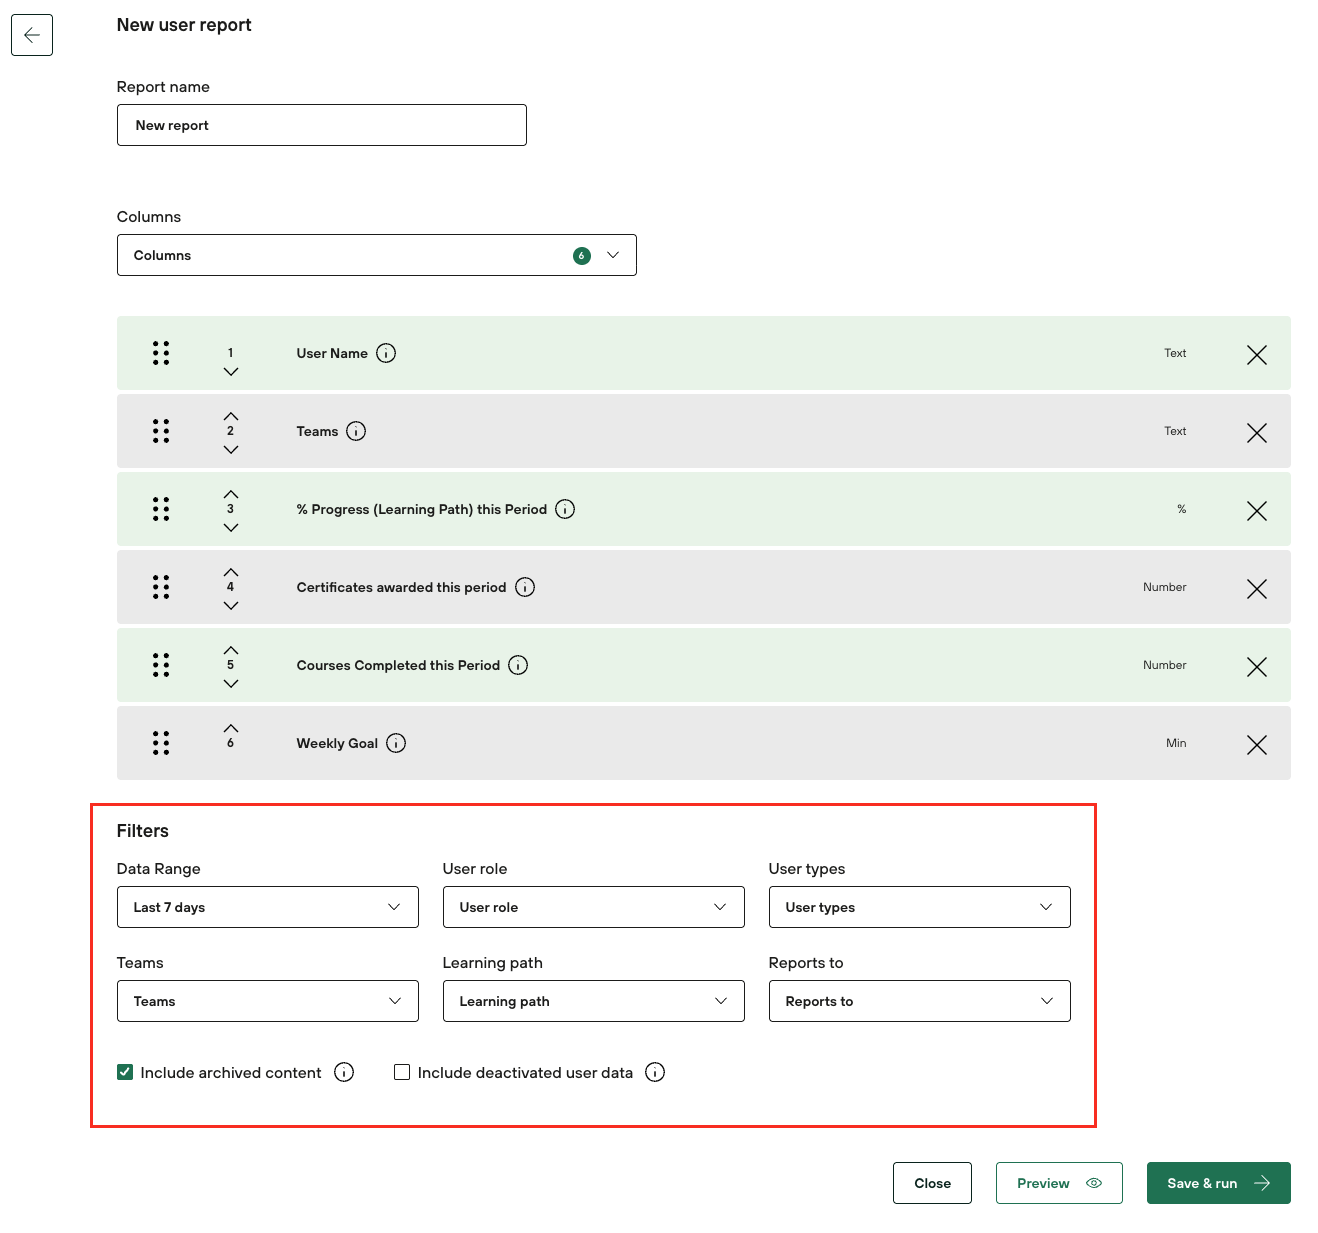
Define the Filter Attributes
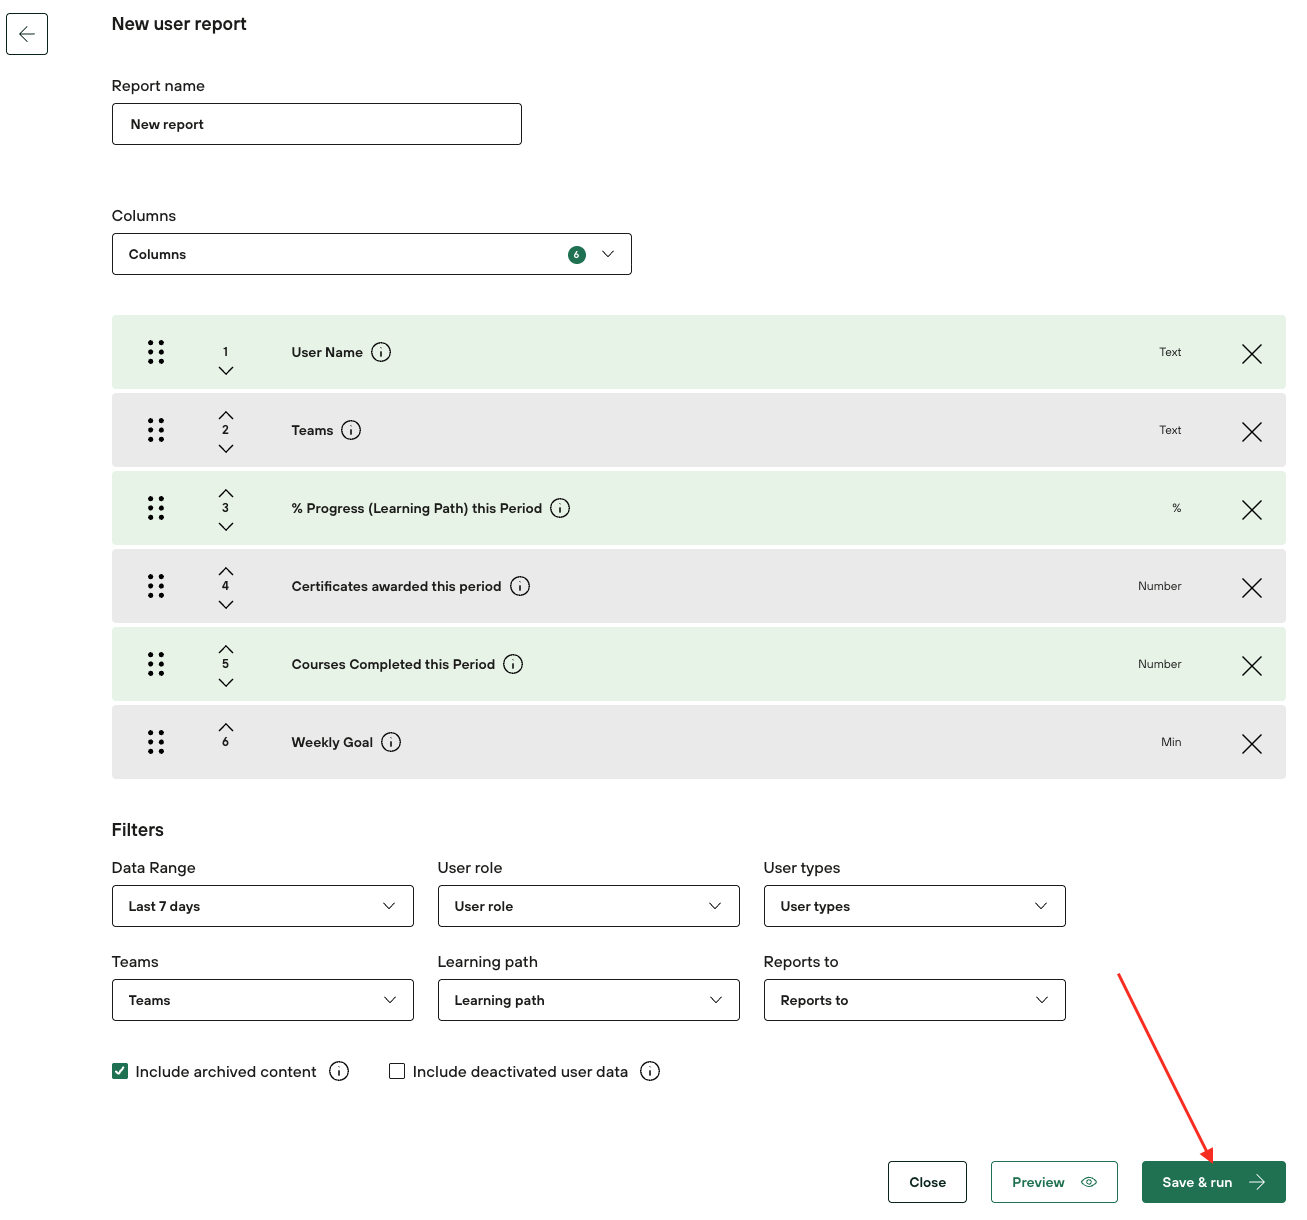
Save and Run!
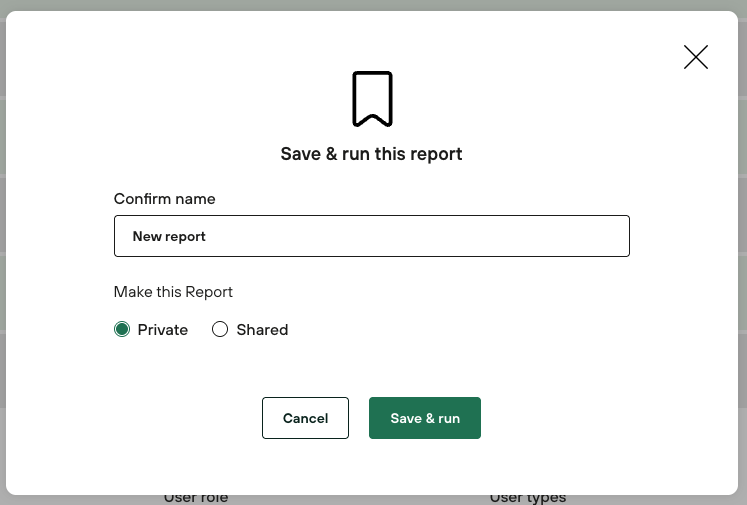
Overwrite the text “New Report” and add the appropriate name for the report
You have the option to make the report Private or Shared.
- Private reports are only viewable by you.
- If you select Shared, the report will be viewable by your colleagues.
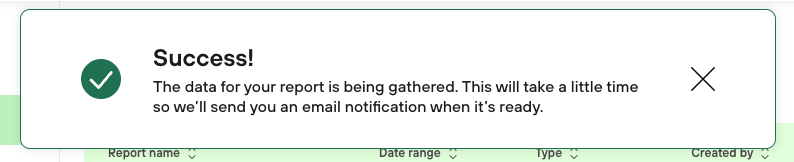
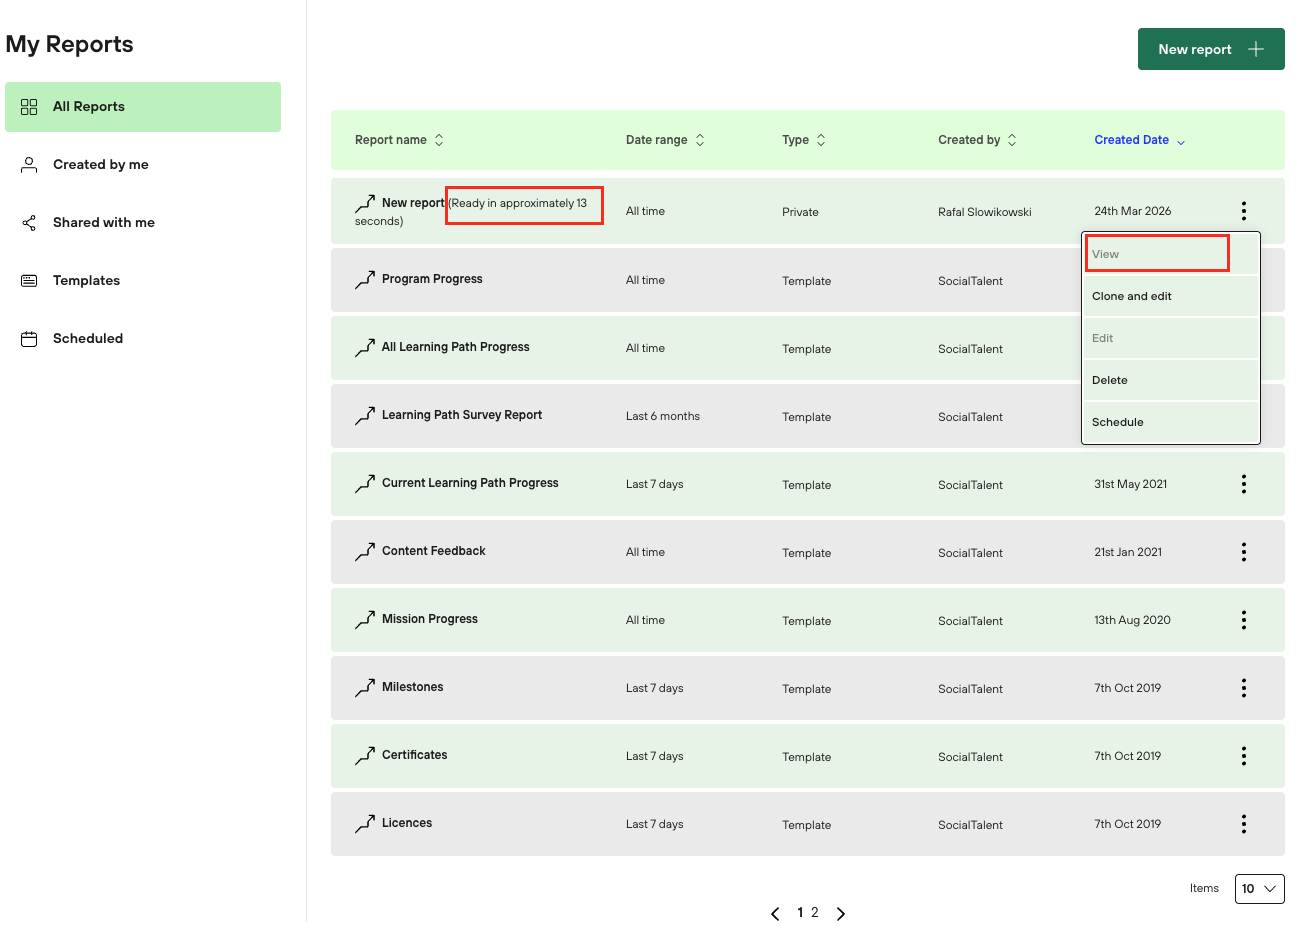
- You can also Clone and edit your colleagues reports.Once you have completed the “Save & Run” process, the report will be in “Pending” state or “Ready in approximately x seconds” with the "View" button greyed out until the report is generated.
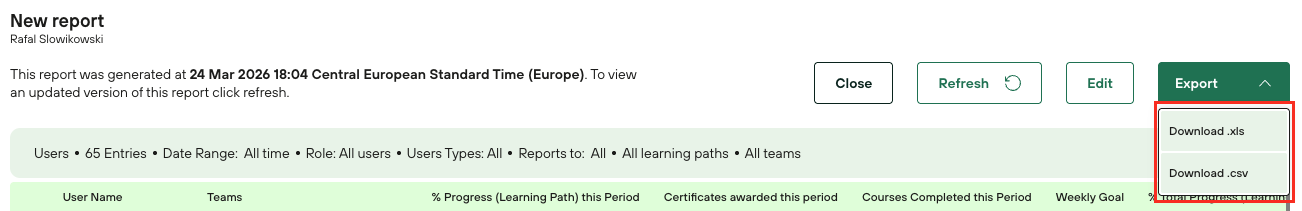
4. After the report is generated, your report will be viewable. The View button is not greyed out anymore.
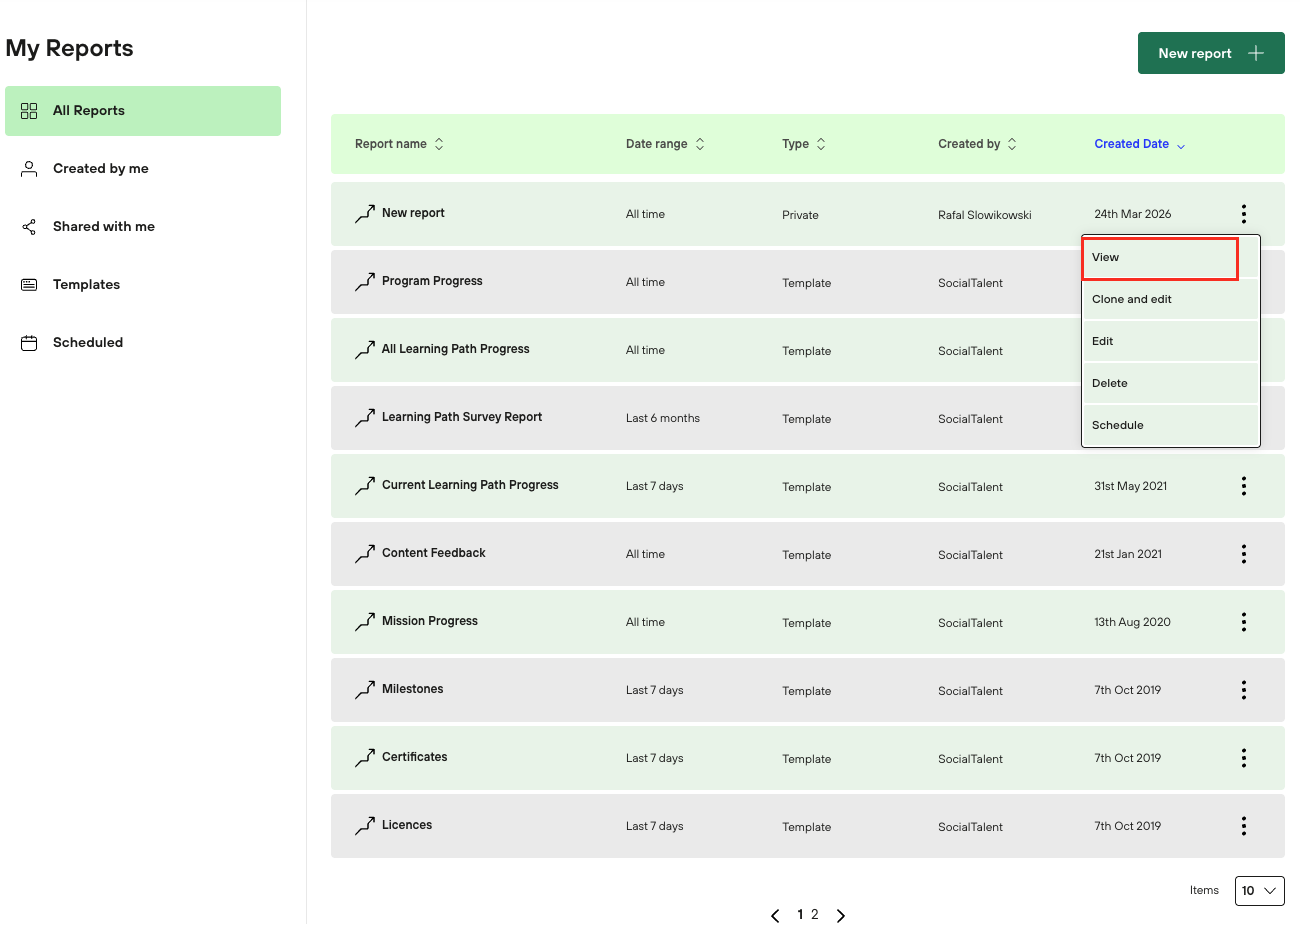
You can also export the report in .xls or .csv format. Reports with large amounts of data will exported to your email address registered on SocialTalent.