
Engagement Dashboard/Bar
The Engagement bar is visible only for Company Admins and Team Leaders
(Statistics are generated each Monday)
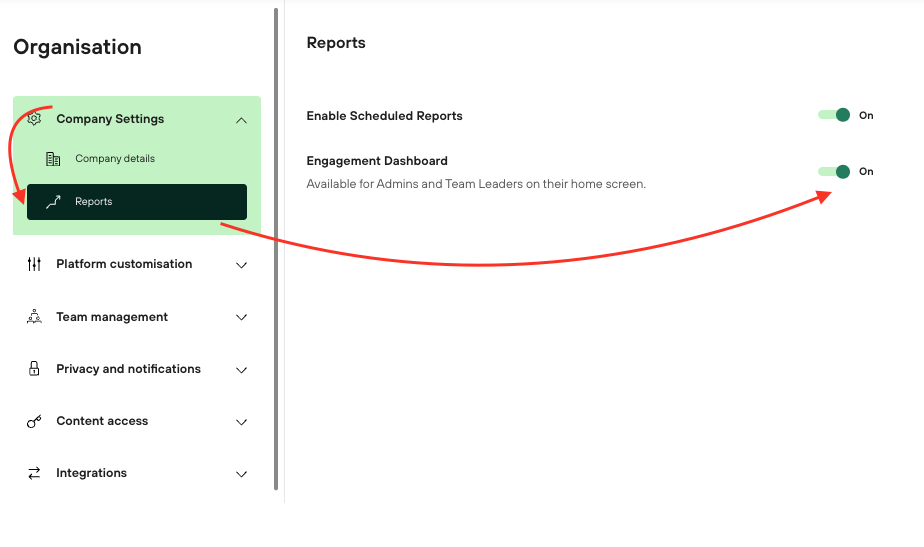
This dashboard can be enabled/disabled by Admin in:
Admin → Organisation → Company Settings → Reports → Engagement Dashboard
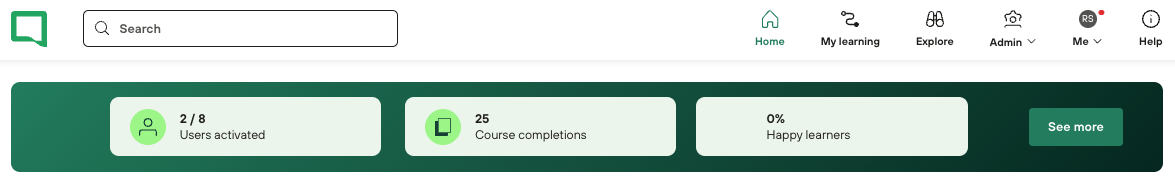
The engagement bar for an admin is a visual representation of the level of engagement and activity on the platform. It takes into account three key metrics: usage, completions, and satisfaction, which are defined as follows:
Users activated: This refers to the number of users activated on the platform.
Course Completions: This metric measures the number of courses that have been completed by learners in the company. The higher the number of completed courses, the more engaged and active the users are on the platform.
Satisfaction: This is based on feedback from users in the company, which is collected through surveys or other feedback mechanisms. The satisfaction rating reflects how happy and satisfied users are with the platform. You can also run a report and check the rating by using our ‘Content Feedback Report’.
The engagement bar provides a quick snapshot of the platform's overall engagement level. Clicking on the "See more" button will take the admin to the detailed reports tab, where they can access more detailed information and metrics to analyze engagement and identify areas for improvement.